

Despite reaching 0.7313, a new two-month high, the Australian Dollar lost some of its weekly gains and ended up around the 0.7240 price range.
Wall Street’s dismal performance, particularly on Friday, hampered demand for the pair, but the weaker Dollar kept it in the black.
A poisonous level of inflation in the US has the Federal Reserve unable to respond promptly. The Dollar fell as the country announced a four-decade high of 7% YoY in December. The core reading was 5.5%, up from 4.9%.
Equities Mirror Market Sentiment
In response to the report, Wall Street rose in relief, as the data fell short of forcing the Federal Reserve to tighten its monetary policy, which it had already disclosed its tightening intentions for 2022.
Although stocks’ momentum began to wane on Thursday, it eventually culminated in a sell-off at the close of the week, giving the Dollar a chance to regain some of its previous gains. The Dollar’s rebound has been slow. A possible explanation is low government bond rates.
The Producer Price Index surged 9.7% YoY in December, while the underlying reading rose to 8.3%, indicating continued inflationary pressures.
Also, initial unemployment numbers for the week ending January 7 were 230K higher than expected for a second week. The 4-week average value, which touched 210K in the same week, showed an ascending trend.
More Crucial Data On The Way
Furthermore, the government announced its December retail sales figures, far worse than expected, dropping by 1.9% month on month (MoM). The Retail Sales Control Group fell by -3.1%.
Finally, the preliminary January Michigan Consumer Confidence Index was lower than expected at 68.8, down from 70.6.
November retail sales rose 7.3% MoM, exceeding the 3.9% predicted. Home loans jumped 7.6% in the same month, while housing construction rose 3.6%. The trade surplus shrank to $A 9.4 billion.
But optimistic Australian numbers should be tempered. The good news is that the nation has finally given up on combating the coronavirus with restrictions. Other economies also had a surge in early 2021, although it was not as strong as expected.
On Monday, China will release December retail sales, industrial production, and Q4 gross domestic product.
Australian data on consumer confidence, inflationary pressures, and jobs will be released later this week. The US macroeconomic schedule is quiet this week, with only weekly unemployment and housing statistics.
Technical Analysis Of The AUD/USD
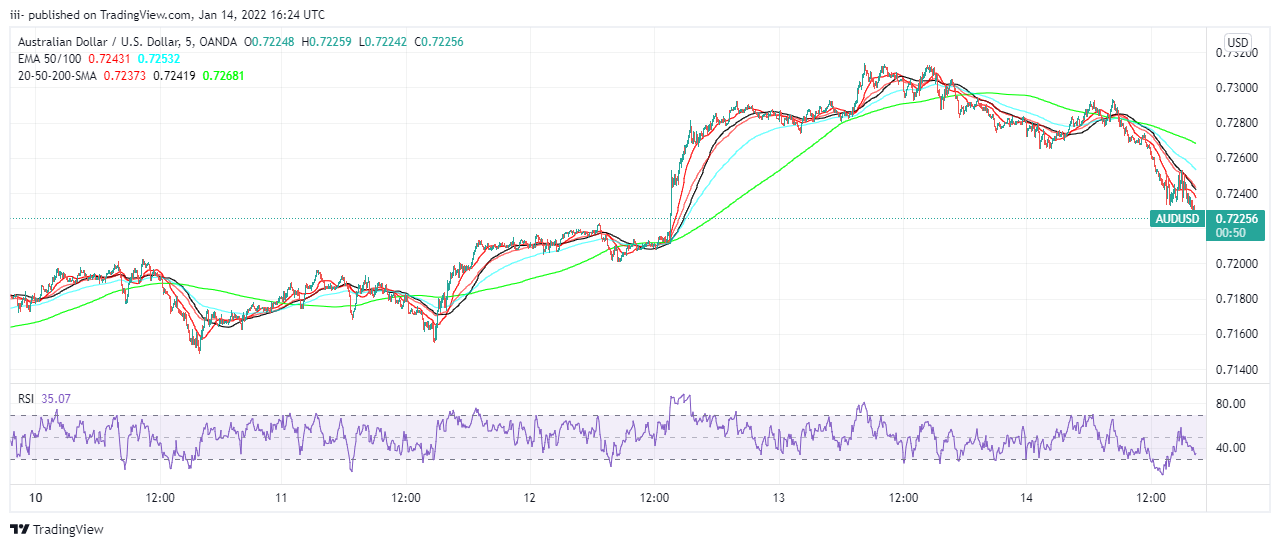
AUD/USD CHART Source: Tradingview.com
In the long term, the AUD/USD pair retains a neutral technical posture in the long term. According to the weekly chart, the pair has moved above its 20 SMA but is now stuck between 100 and 200 SMAs. Technical indications indicate a lack of midline solidity.
As shown on the daily chart, sellers defended the upward at a flat 100 SMA, but the price stayed above a modestly positive 20 SMA, which is now concurrent with the 38.2% retrace of the 0.7555/0.6992 decline. Chart patterns are reaching their midlines.
The set could turn positive if it breaks above 0.7340, the 61.8% retracement of the previous downturn, with targets of 0.7420 or 0.7440.
Above here, the pair may continue its advances to the range’s top. A break beneath 0.7205, the next Fibonacci support mark, opens the door to a test of 0.7070.