
Following the latest downhill trajectory that saw the Pound fall to three-week lows of 1.3440, the Pound is licking its wounds beneath 1.3500, as bears take a well-deserved break.
Rising political uncertainty in the United Kingdom and an expanding risk-off mentality impacted the high-beta currency, the Pound, maintaining a pessimistic tone surrounding the currency.
In response to the escalation of geopolitical hostilities between Russia and Ukraine, NATO prepared its forces in Eastern Europe, which worried markets and boosted interest in the US Dollar as a safe-haven asset.
Review Of The Fundamentals
Furthermore, the Dollar gained from predictions of a rapid increase in the Federal Reserve’s interest rate, as the globe’s most influential banking system is expected to hint at policy stabilization when it closes its two-day meeting on Wednesday.
Between now and then, the wider market attitude, Russia-Ukraine headlines, and geopolitical events in the United Kingdom will all continue to have an impact on the major.
Following the GBP/USD daily chart, the pair remains vulnerable to further fall towards the horizontal 100-Daily Moving Average (DMA) at 1.3421. A sustained breach below Monday’s low of 1.3440 would trigger more drops towards the horizontal 100-Daily Moving Average (DMA) at 1.3421.
This is shown by the fact that the 14-day Relative Strength Index (RSI) is edging down and below the midline, indicating that there is more opportunity for the currency pair to decline.
The next key level of support may be found at the round number of 1.3400.
Acceptance above the slightly bearish 50-day moving average (50-DMA) at 1.3536 on a daily closing basis, on the other hand, is critical to any recovery from multi-week lows.
The 21-day moving average (21-DMA) at 1.3565 will next pose a test to the bulls as they attempt to retake the 1.3600 resistance level.
GBP/USD Technical Analysis
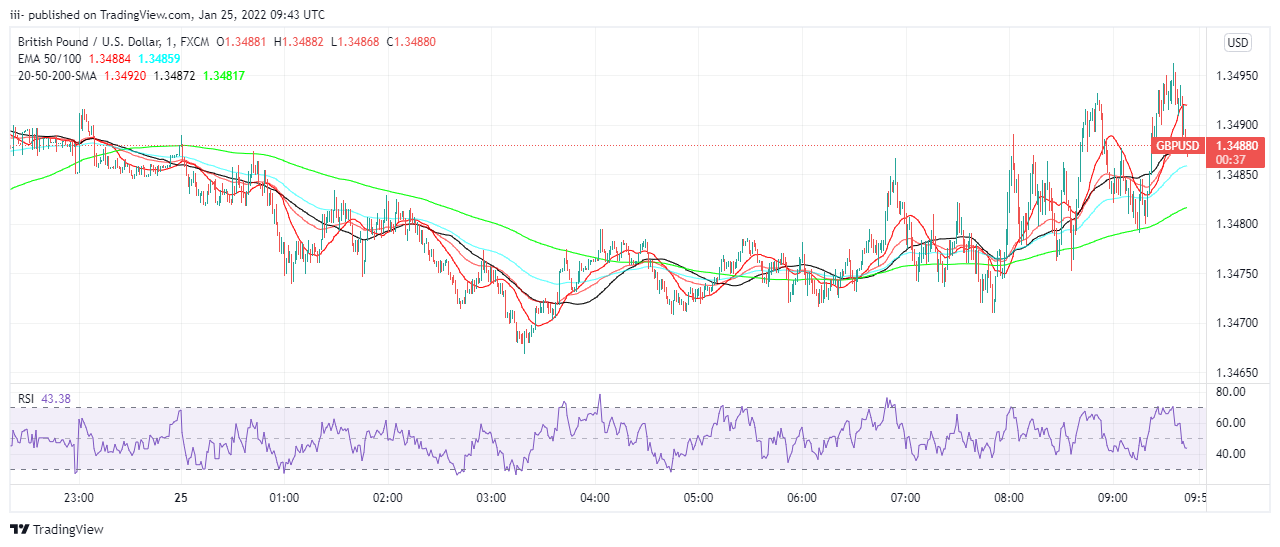
GBP/USD CHART Source: Tradingview.com
The Pound/Dollar remains below the 100-period simple moving average (SMA) on the four-hour chart. The Relative Strength Index (RSI) signal on the same chart, which confirms the near-term negative bias, continues to drift sideways towards the 40-point level.
On the downside, the initial support level is around 1.3530 (the Fibonacci 38.2% retracement of the one-month-old rally), which corresponds to the 38.2% retracement of the upswing.
In the event that this level proves to be a barrier, the pair might try for 1.3500 (the psychological threshold) and 1.3460 (200-period SMA).
A significant amount of resistance appears to have built near 1.3600 (Fibonacci 23.6% retracement, 100-period SMA). As long as the pair maintains a daily close above that level, it may be possible to see significant additional gains toward 1.3640. (50-period SMA).