

The AUD/USD cross is flat for the week, hovering below 0.7200. The pair hit 0.7276 on Thursday, aided by positive Australian data that couldn’t overcome the Dollar’s increased demand.
Fear Of Loss And High Yields
During the week, market investors were anxious about slower economic growth due to rising inflation or stagflation. Global indices were under stress, with Wall Street losing ground.
On the other front, Gold prices rose to new two-month highs, closing the week at around $1,840 an ounce.
And finally, as global stagflation expands, government bond rates surge, an unprecedented occurrence in the current risk-off atmosphere.
The spread of Omicron hampered the economic recovery, and job data began to disappoint. Inflation remained high in most wealthy nations, reaching multi-decade highs.
The latest Australian statistics belie that the country is likewise heading for stagflation. For most of 2021, Australia was closed, and it was just recently reopened.
That’s why it’s “booming,” with record employment growth in November and a positive December report this week. In March, the country added 64.8K jobs, exceeding market expectations.
The report’s key highlights were an unexpectedly low unemployment rate of 4.2% and a stable 66.1% participation rate.
Also, January consumer inflation estimates fell to 4.4% from 4.8%, which is good news. However, it remains to be seen if the economy can maintain consistent job creation and moderate inflation.
A Busy Schedule Awaits
Unlike recent days, the following week will ba busy with macroeconomic data. On Monday, both economies will post preliminary January PMIs, while Australia will issue December NAB Business Confidence and Q4 CPI on Tuesday.
Later in the week, Canada releases its December Westpac Leading Index and Q4 Producer Price Index.
On January 26, the US Federal Reserve will declare its monetary policy. No action is expected now, but market investors are looking for more clarity about future rate rises.
Investors expect a March 2022 rate rise and three more raises during the year. The government will also release its first estimate of Q4 GDP (5.8% QoQ) and December Durable Goods Orders. The US will release its preferred inflation indicator, the Core Personal Expenditures Price Index, on Friday.
Outlook For AUD/USD
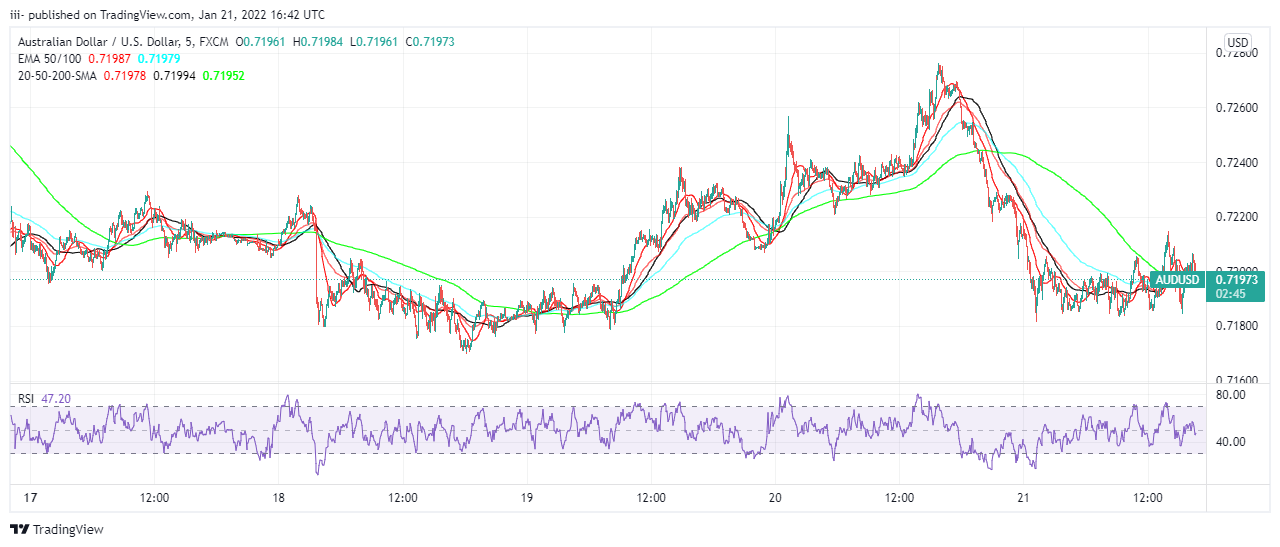
AUD/USD CHART Source: Tradingview.com
The AUD/USD weekly chart shows it caught between two simple directionless moving, with a bearish 20 SMA restricting the upside.
The momentum signal is declining, while the RSI stabilizes around 45, indicating downside danger. The pair is also battling the 38.2% breakdown of its 0.7555/0.6992 fall.
The daily chart is moderate to bearish. The pair moves below a flat 20 SMA, with a moderately bearish 100 SMA converging with the 50% retracement of the noted loss around 0.7275. Meanwhile, chart patterns lack direction and oscillate about their midlines.
Bulls may take control with a break over 0.7275, with 0.7340 being the 61.8% retrace of the same decline. Beyond that, the pair may climb to 0.7400. Below 0.7130, the risk is to the downside, with a test of 0.7000 being possible.